


Introduction
Every retiree eventually confronts the same question: once savings stop growing through paychecks and start shrinking through spending, how should money be drawn down? The answer shapes not only how long a portfolio lasts, but how a retiree experiences the market's inevitable ups and downs along the way. Five approaches dominate professional and academic discussion of this problem: the Bucket Strategy (time-segmentation), the Total Return Strategy on a calendar rebalancing schedule, a Total Return variant using automated threshold rebalancing, the 4% Rule (constant-dollar withdrawal), and Dynamic Spending, commonly implemented through the Guyton-Klinger guardrails.
These strategies are not simply competing formulas; they represent different philosophies about which risk matters most — running out of money, watching a portfolio wither during a bear market, uncontrolled concentration drift, or the psychological toll of uncertainty. This paper compares the five approaches side by side, summarizes the peer-reviewed and practitioner research behind each, and illustrates the practical differences using a representative retiree who stands to gain the most from these marginal design choices: someone withdrawing near the boundary of what history shows is comfortably sustainable.
Strategy Overview at a Glance
Table 1 summarizes the mechanics, research-supported withdrawal rates, and behavioral profile of each strategy. Figure 1 places the commonly cited initial withdrawal-rate ranges side by side.
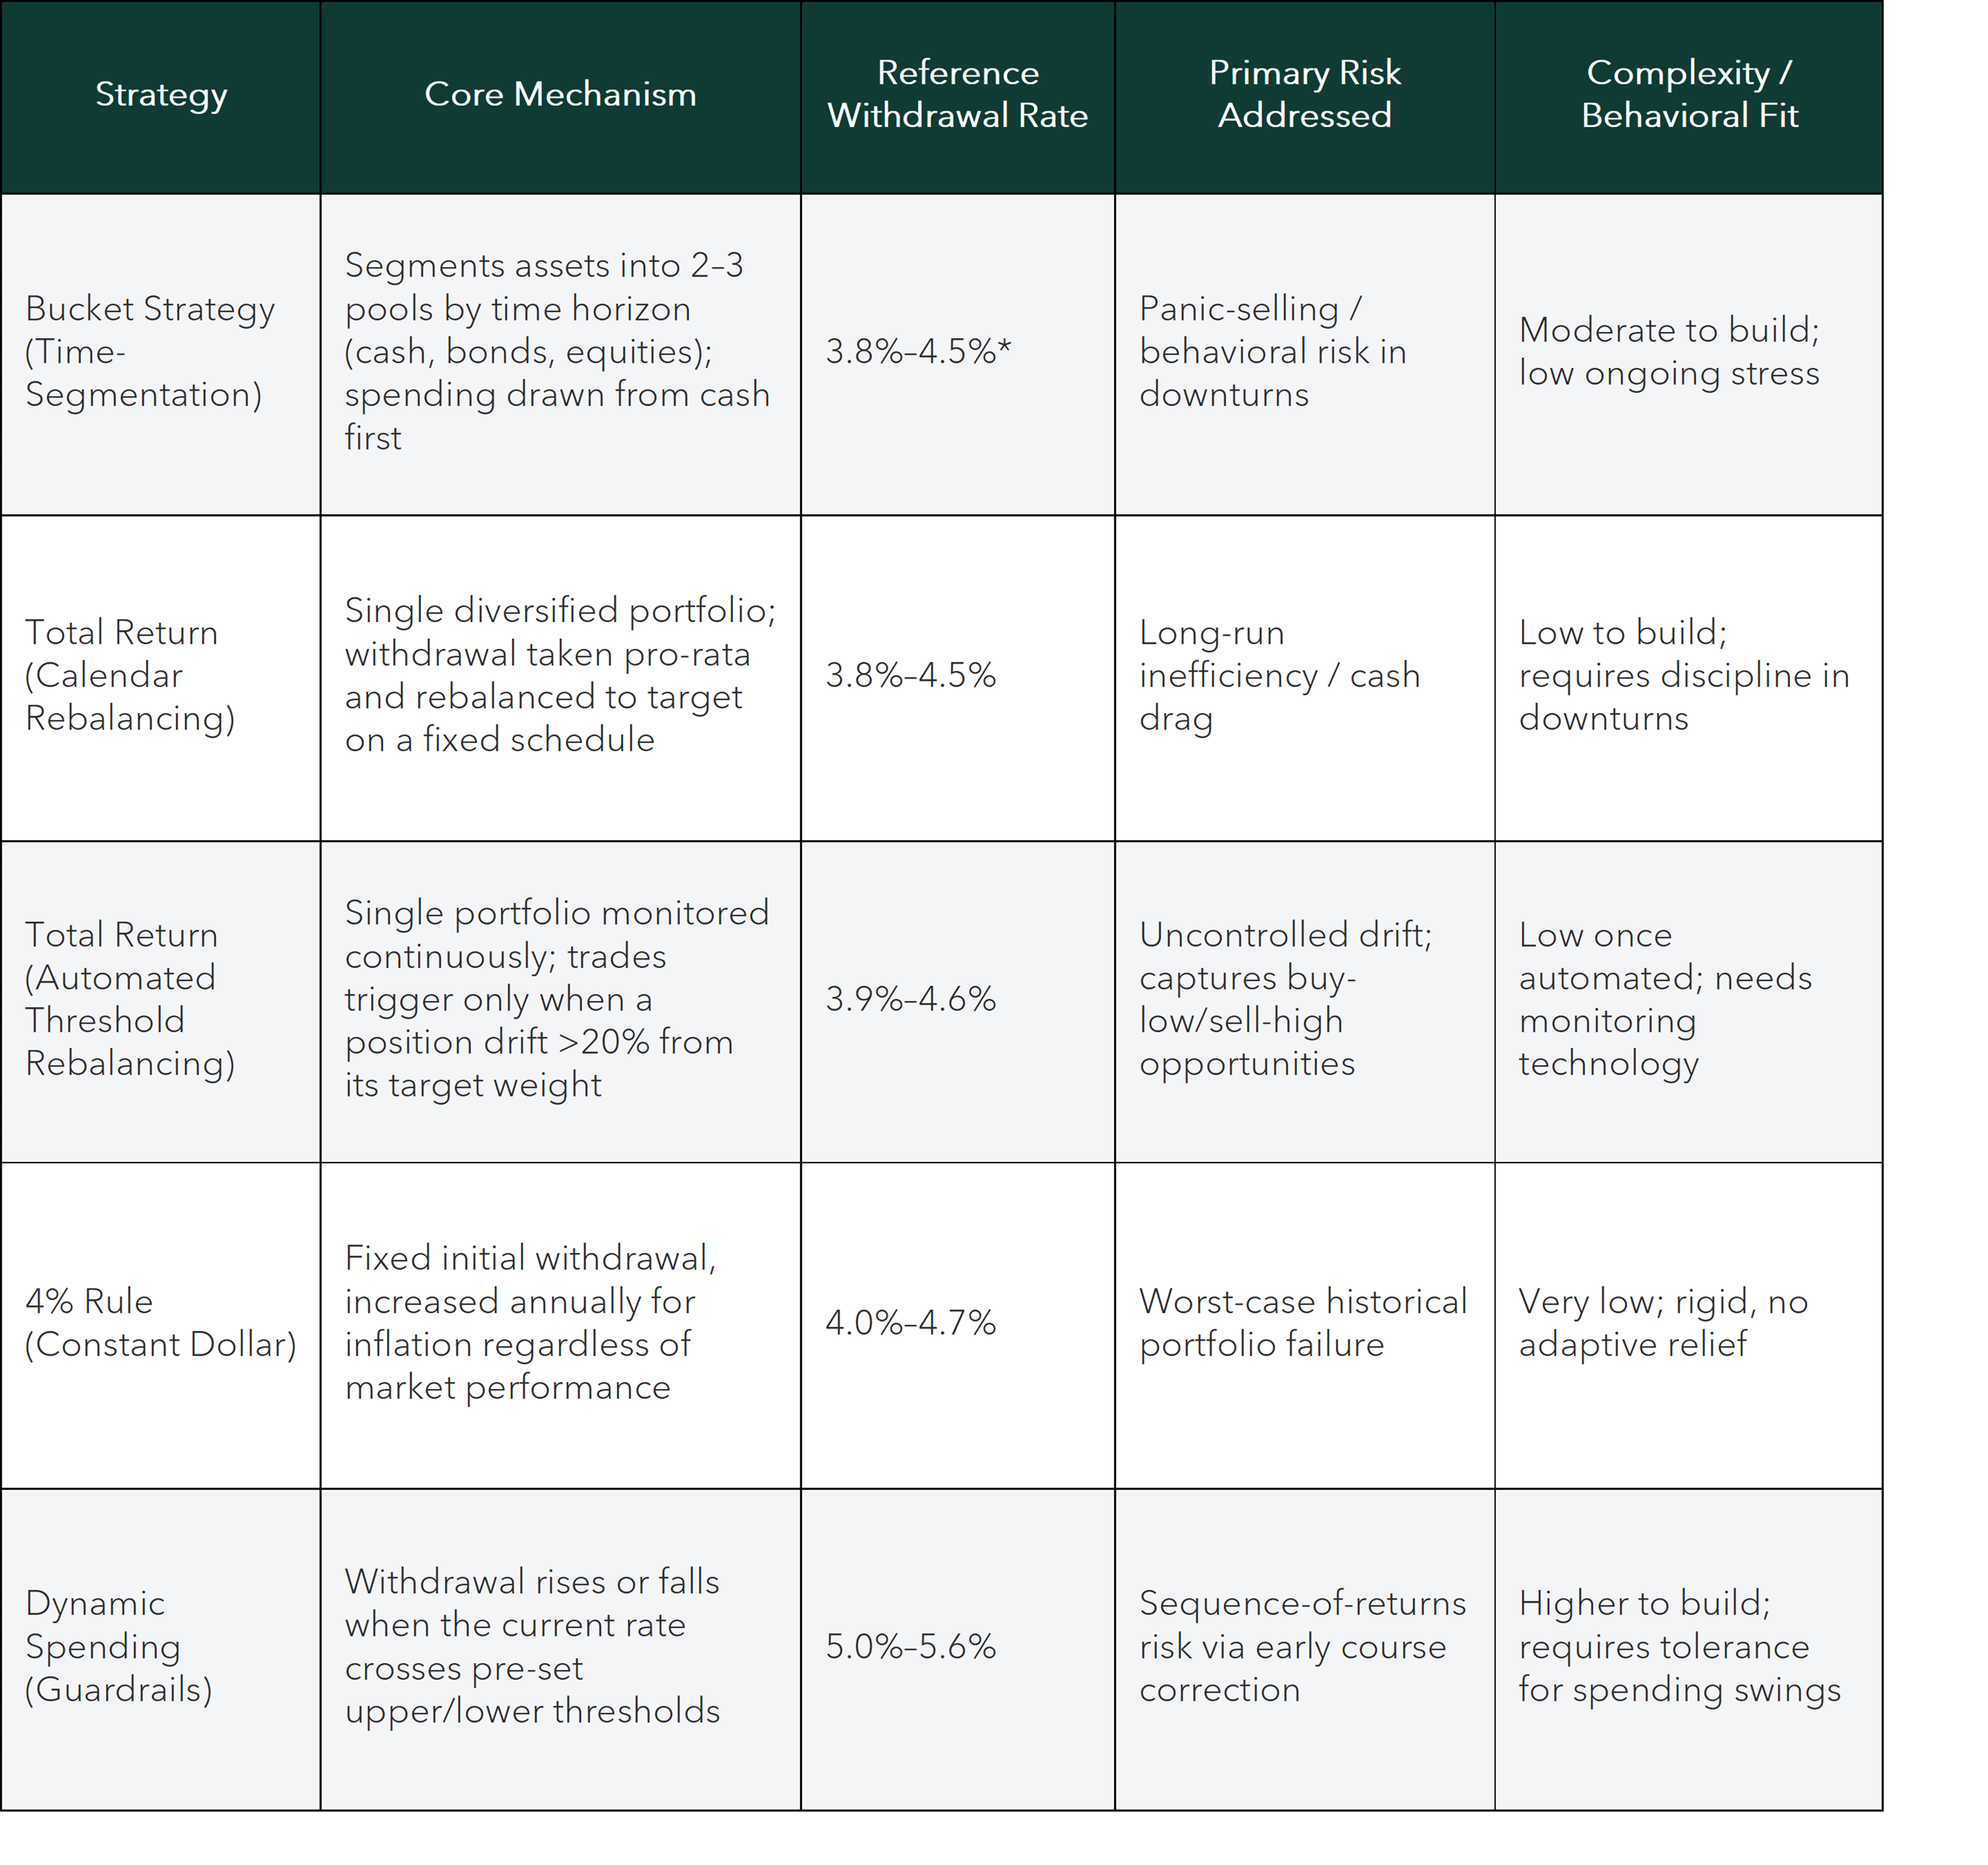
Table 1. Comparison of five retirement withdrawal strategies. *The Bucket Strategy has no independent mathematical withdrawal-rate premium; its rate tracks the withdrawal rate of its underlying stock/bond allocation (Estrada, 2019).
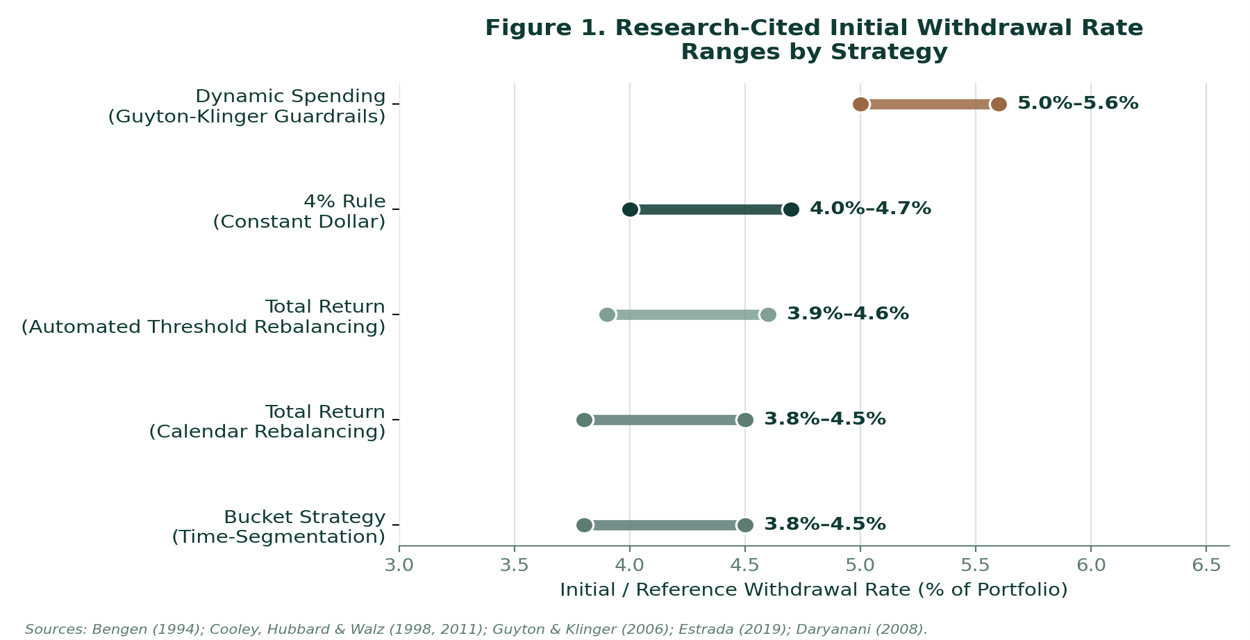
Sources: Bengen (1994); Cooley, Hubbard & Walz (1998, 2011); Guyton & Klinger (2006); Estrada (2019); Daryanani (2008).
The Bucket Strategy (Time-Segmentation)
The bucket approach divides a portfolio into two or three pools organized by when the money will be spent rather than by asset class alone. A near-term bucket holds one to two years of spending in cash and cash equivalents; a mid-term bucket holds bonds and income-producing assets to cover roughly the next several years; and a long-term bucket remains invested in equities for growth beyond a decade out. Retirees spend down the cash bucket first and refill it periodically from the other buckets — ideally in years when markets cooperate, rather than through forced sales during a downturn.
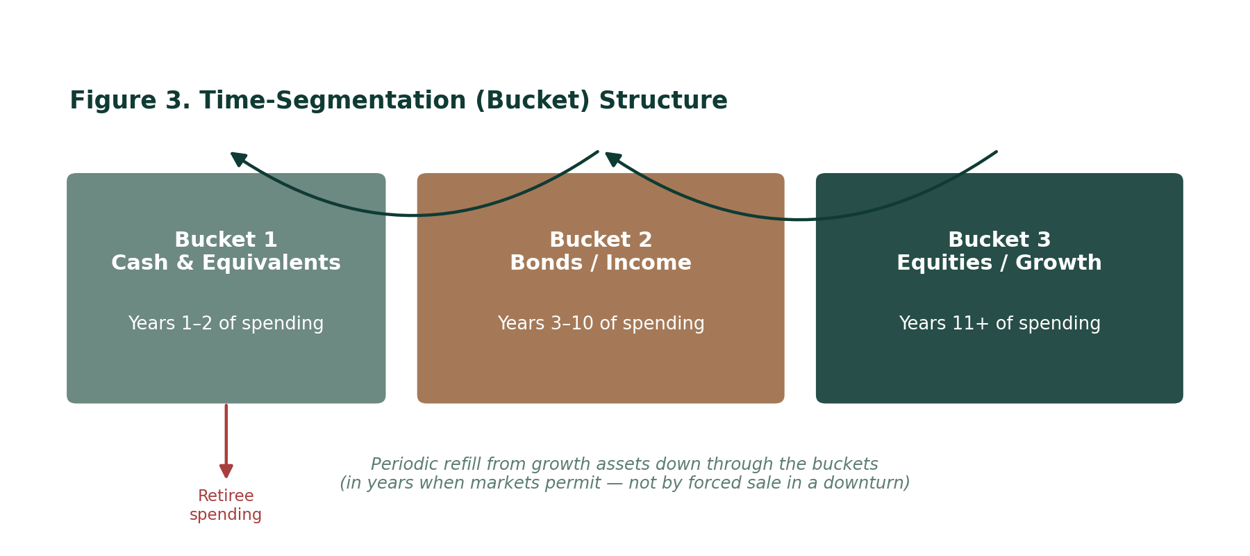
Figure 3. A typical three-bucket time-segmentation structure.
The strategy's appeal is almost entirely behavioral rather than mathematical. Javier Estrada's analysis of 21 countries across 115 years of market history, published in the Journal of Investing, found that static allocations rebalanced periodically generally matched or outperformed time-segmented bucket portfolios with an equivalent overall stock/bond mix; he characterized bucketing as a “suboptimal behavioral trick” in expected-return terms (Estrada, 2019). Michael Kitces reached a similar conclusion, describing bucket strategies as an “asset allocation mirage” because a bucket portfolio's blended return is mathematically indistinguishable from a static portfolio holding the same overall allocation (Kitces, 2014). What buckets do provide is a clear, pre-committed rule for what to do in a downturn: hold the growth bucket and spend the cash bucket — a structure that guards against the panic-selling that erodes many retirees' real-world returns.
The Total Return Strategy (Calendar Rebalancing)
Total return investing treats the portfolio as a single, diversified whole. A retiree selects a target allocation — commonly a 60/40 or similar stock/bond mix — withdraws a chosen dollar amount or percentage each period, and rebalances back to that target on a fixed schedule, such as quarterly or annually, regardless of which asset class funded the withdrawal. The foundational research here is the same historical-simulation literature behind the 4% Rule: Cooley, Hubbard, and Walz's Trinity Study modeled withdrawals from rebalanced stock/bond portfolios of varying compositions across rolling historical periods, finding that portfolios with at least 75% in equities sustained withdrawal rates in the 4% to 5% range with high historical success rates (Cooley, Hubbard, & Walz, 1998; 2011).
Because the entire portfolio remains invested and rebalanced, the total return approach is simple to administer and avoids the cash drag of holding several years of spending in low-yielding instruments. Its principal weakness is behavioral: because withdrawals are taken proportionally from all holdings, a retiree must sell equities — including during a decline — to fund spending, which is precisely the moment that triggers costly, panic-driven deviations from plan for many investors.
Total Return with Automated Threshold Rebalancing (20% Divergence Band)
A more targeted variant of total return investing replaces the calendar with a drift trigger. Rather than rebalancing on a fixed schedule, the portfolio is monitored on an ongoing basis, and a trade is executed only when a single position's weight diverges by more than a set percentage from its target — commonly 20% of that position's original weighting (a 30% equity sleeve, for example, is rebalanced once it exceeds roughly 36% or falls below roughly 24% of the portfolio). Gobind Daryanani's widely cited 2008 Journal of Financial Planning study tested rolling five-year periods from 1992 to 2004 across a five-asset-class portfolio and found a 20% relative tolerance band close to optimal, estimating it added 0.40 to 0.45 percentage points of annualized return over traditional annual rebalancing by more consistently capturing buy-low, sell-high opportunities as asset classes drift apart (Daryanani, 2008).
The approach carries real caveats. A follow-up analysis in the Journal of Financial Planning found the size of this historical benefit is sensitive to the period studied and can vary meaningfully across market environments (Delorme, 2021). Because trades fire on drift rather than a calendar, the strategy also depends on monitoring technology to be practical for most retirees, and each triggered trade can carry transaction costs and, in taxable accounts, capital-gains consequences that a periodic or bucket-based approach may let a retiree anticipate more easily.
The 4% Rule (Constant-Dollar Strategy)
William Bengen's 1994 study in the Journal of Financial Planning tested a 50/50 stock-and-bond portfolio against every 30-year retirement period beginning between 1926 and the mid-1960s, holding the inflation-adjusted dollar withdrawal fixed regardless of market performance. He found that an initial withdrawal of roughly 4.15% survived even the worst historical starting cohort — a result nicknamed the “4% Rule,” though Bengen himself called it SAFEMAX, the maximum safe withdrawal rate under worst-case conditions (Bengen, 1994). A 2023 replication in the Journal of Financial Planning revisited the analysis with 30 additional years of data and confirmed the original finding remains close to Bengen's estimate, while noting that relaxing the fixed-withdrawal and fixed-allocation assumptions can improve portfolio longevity further (Duquette, 2023).
The rule's chief strength is also its chief limitation: it is deliberately unresponsive to markets. A retiree following it strictly is protected from behavioral second-guessing, but the plan cannot take advantage of strong markets or reduce spending proactively ahead of a downturn. Because it is calibrated to history's worst cohort, most historical retirement periods left the 4% retiree with substantially more wealth than they started with — a conservative bias later research, including Bengen's own updated work, has argued may be unnecessarily cautious for many retirees (Duquette, 2023).
Dynamic Spending (Guardrails Strategy)
Jonathan Guyton and William Klinger's 2006 Journal of Financial Planning study tested a rules-based alternative: begin with a higher initial withdrawal rate, then apply pre-set “guardrails” that adjust spending as the portfolio drifts. Under their Capital Preservation Rule, if the current withdrawal rate rises more than 20% above the initial rate — signaling the portfolio has fallen — the next year's withdrawal is cut by 10%. Under the mirror-image Prosperity Rule, if the current rate falls more than 20% below the initial rate, the withdrawal is raised by 10%. Using stochastic modeling across two historical data periods, the study found initial withdrawal rates of roughly 5.0% to 5.6% were sustainable at a 99% confidence level for portfolios holding at least 65% equities — a meaningfully higher starting point than the 4% Rule permits (Guyton & Klinger, 2006).
The trade-off is variability: a guardrails retiree accepts the possibility of an explicit spending cut in a bad market in exchange for a higher expected lifetime withdrawal. Subsequent practitioner research has also questioned whether withdrawal-rate-based guardrails alone adequately capture retirees' true risk of running out of money, spurring newer “risk-based” guardrail variants built on Monte Carlo probability of success rather than a fixed percentage trigger (Kitces, 2014). Even so, Guyton-Klinger remains the most widely cited dynamic framework and the clearest illustration of how systematic flexibility can widen the sustainable withdrawal range documented since Bengen's original work.
Why the Order of Returns Matters
A theme runs through the research behind all five strategies: it is not simply the average return a portfolio earns over retirement that determines success, but the order in which returns arrive. Because a retiree's portfolio is typically at its largest early in retirement, a market decline in the first decade removes far more in dollar terms than an identical percentage decline later on, after years of withdrawals have already reduced the balance. Wade Pfau's research estimates that roughly 77% of a retirement portfolio's ultimate outcome can be explained by average returns in just the first ten years, and Pfau and Kitces's Journal of Financial Planning study on rising equity glide paths built directly on this finding to argue for holding more conservative allocations at the point of retirement (Pfau & Kitces, 2014).
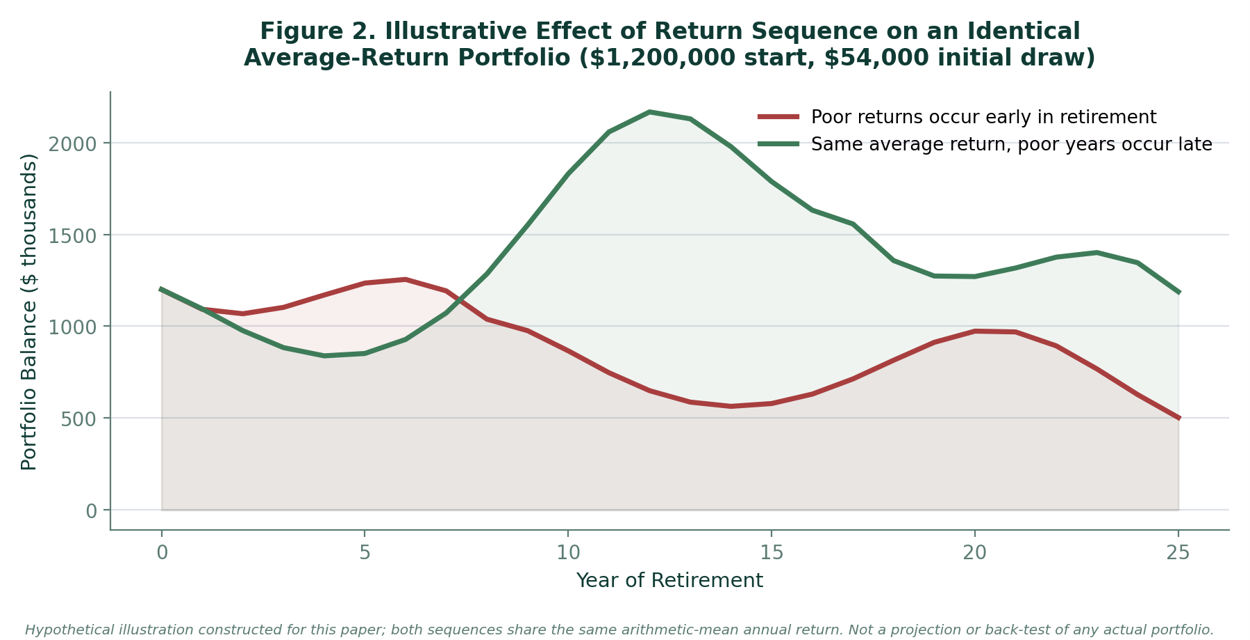
Figure 2. A hypothetical illustration built for this paper, not a back-test of an actual portfolio; both trajectories share the same arithmetic-mean annual return.
This is the risk each strategy addresses differently. The Bucket Strategy insulates near-term spending in cash so a downturn does not force equity sales. The 4% Rule survives sequence risk by being calibrated to history's worst-known sequence in advance. Dynamic guardrails respond to sequence risk as it unfolds, cutting spending when early returns are unfavorable. Automated threshold rebalancing manages the related risk of concentration drift, and can incidentally buy depressed equities with proceeds from an overweight bond sleeve. Calendar-based total return investing, by contrast, manages sequence risk only through its underlying asset allocation and offers no separate structural buffer.
Quantitative Illustration: A Representative Retiree
Consider Susan, age 65, who retires with a $1,200,000 portfolio in a 60/40 stock-and-bond allocation. She wants to withdraw $54,000 in her first year — 4.5% of her balance — to supplement Social Security. Susan is a strong candidate to feel the marginal differences between these strategies: her target withdrawal rate sits above the traditional 4% Rule's conservative baseline but within the range Guyton-Klinger's research supports, and roughly 15% to 20% of her budget is discretionary, giving her genuine room to adjust spending if a strategy calls for it. Table 2 illustrates how her first year, and her response to a hypothetical 25% market decline in year two, would differ across strategies.
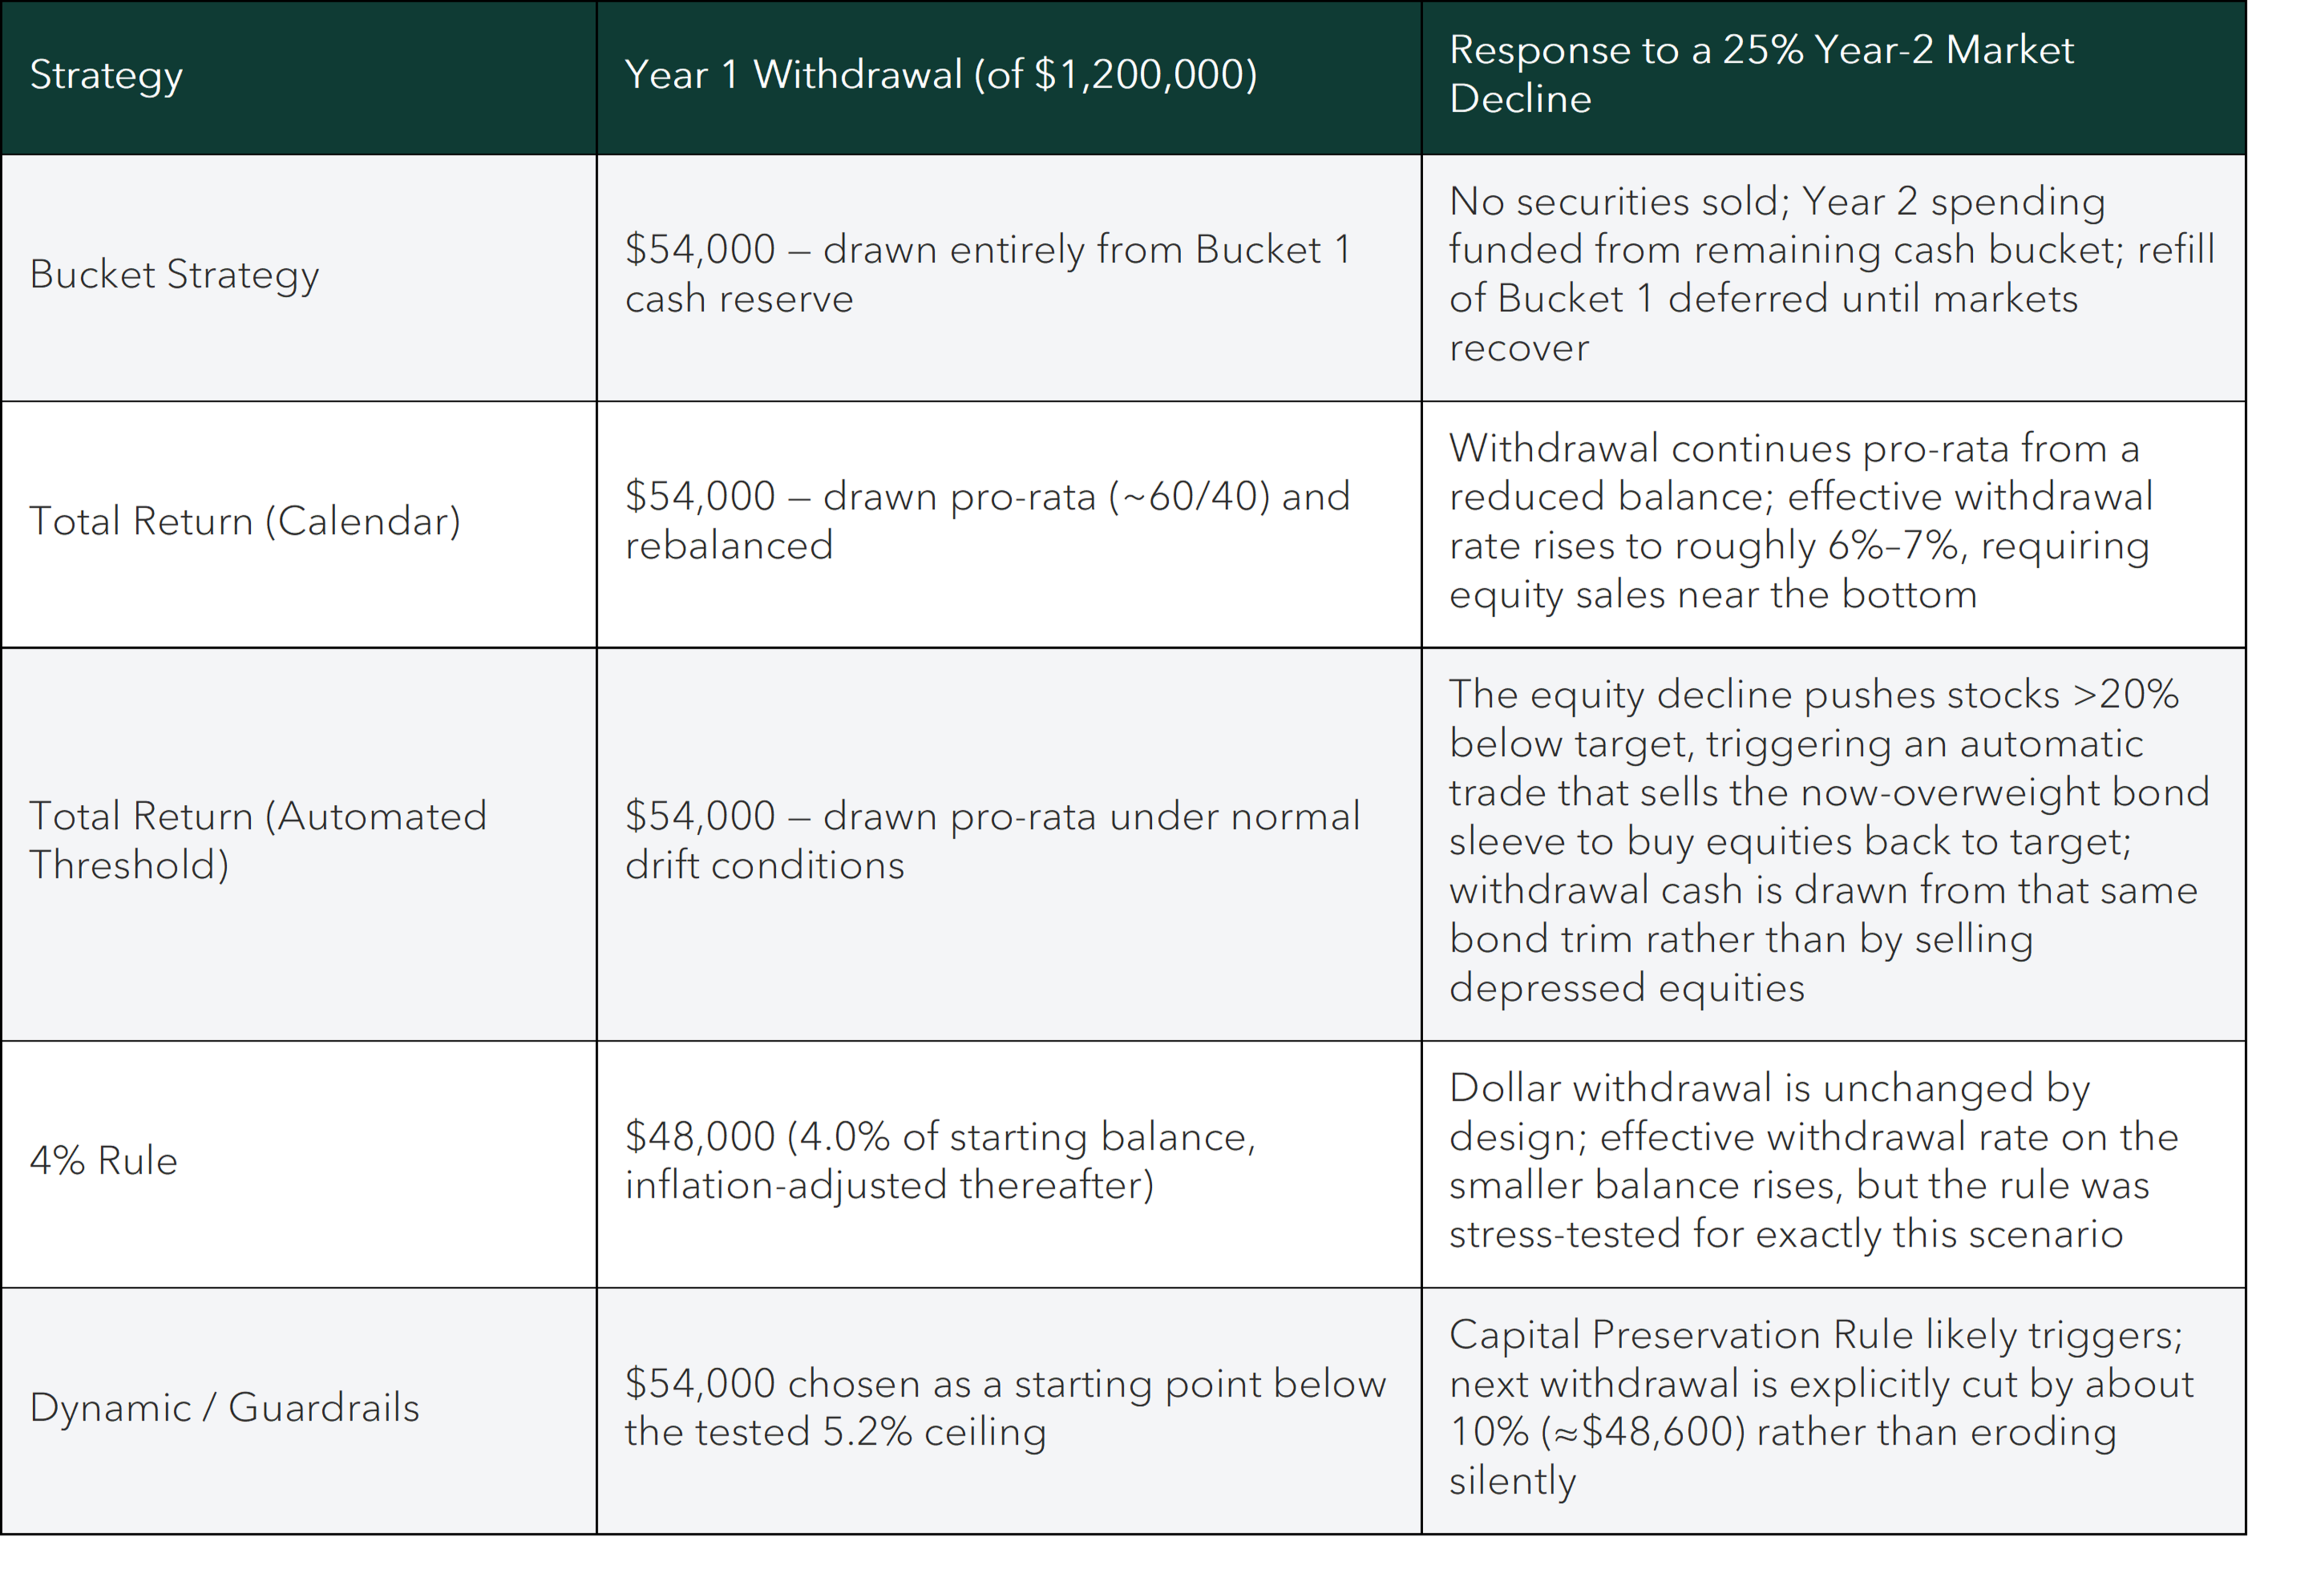
Table 2. Illustrative, rounded figures constructed for this paper to demonstrate mechanical differences between strategies; not a projection, guarantee, or back-test of actual market outcomes.
The comparison shows the five strategies are not truly separated by their year-one math — all can fund a similar initial withdrawal for a retiree like Susan. They diverge in what happens next. The 4% Rule and calendar-based Total Return both continue largely on autopilot after a decline, for better (predictability) or worse (no adaptive relief). The Bucket Strategy and guardrails approach each give Susan an explicit, pre-committed response to a bad market, while automated threshold rebalancing turns the same decline into a disciplined buying opportunity funded from the relatively overweight asset class — three distinct ways of converting research into a concrete plan for the moment markets misbehave.
Conclusion
Weighed against one another, Total Return with Automated Threshold Rebalancing has the strongest evidentiary claim to being the optimal default among the five. It is the only strategy in this comparison with a peer-reviewed, positive return estimate attached to its mechanism rather than to its withdrawal rate: Daryanani (2008) found the 20% relative band added 0.40 to 0.45 percentage points of annualized return over calendar rebalancing during the sample period, and Delorme's (2021) independent test of the same threshold through the 2020 crash found it captured a similar buy-low advantage during actual market turbulence. No comparable, mechanism-level return benefit has been documented for the 4% Rule, calendar-based Total Return, or the Bucket Strategy — each of those either accepts a cost (cash drag, in the Bucket Strategy's case) or trades away return for behavioral comfort or worst-case protection, without evidence that the trade pays for itself. Threshold rebalancing also addresses sequence-of-returns risk as a byproduct of its ordinary operation: a market decline that pushes equities more than 20% below target automatically triggers a purchase funded from the now-overweight bond sleeve, converting the exact conditions that most damage a retiree's plan into a disciplined buying opportunity — the same buy-low outcome that Dynamic Guardrails pursue only by cutting the retiree's spending, and that the Bucket Strategy pursues only by holding several years of low-yielding cash. Because it rebalances on drift rather than on a withdrawal-rate trigger, it is also rate-agnostic: it can be layered under a conservative 4%-Rule withdrawal or a more aggressive guardrails-style rate alike, functioning as a portfolio-management upgrade rather than a competing spending philosophy.
The strategy's real caveats are narrower than they first appear. Delorme (2021) found the size of the historical benefit varies by period, but even the least favorable thresholds tested still outperformed an unrebalanced portfolio, and the 20% band specifically held up across two independently studied periods separated by more than a decade. Its other objection — that it requires continuous monitoring — has been substantially reduced by the drift-alert tools now built into most custodial and advisory platforms, which make threshold rebalancing no more operationally demanding for a retiree than a calendar reminder. On the evidence assembled in this paper, a retiree who wants the highest risk-adjusted confidence in their withdrawal strategy should treat automated threshold rebalancing as the structural foundation of their portfolio, with the specific withdrawal rule — 4% Rule, guardrails, or a modest cash buffer for peace of mind — layered on top as a matter of personal risk tolerance rather than mathematical necessity.
References
Bengen, W. P. (1994). Determining withdrawal rates using historical data. Journal of Financial Planning, 7(4), 171–180.
Cooley, P. L., Hubbard, C. M., & Walz, D. T. (1998). Retirement savings: Choosing a withdrawal rate that is sustainable. AAII Journal, 20(2), 16–21.
Cooley, P. L., Hubbard, C. M., & Walz, D. T. (2011). Portfolio success rates: Where to draw the line. Journal of Financial Planning, 24(4), 48–60.
Daryanani, G. (2008). Opportunistic rebalancing: A new paradigm for wealth managers. Journal of Financial Planning, 21(1), 48–61.
Delorme, L. (2021). How much did rebalancing help in 2020? Journal of Financial Planning, 34(5).
Duquette, C. M. (2023). Revisiting William Bengen's ‘SAFEMAX’ portfolio withdrawal rate. Journal of Financial Planning (Financial Planning Association).
Estrada, J. (2019). The bucket approach for retirement: A suboptimal behavioral trick? The Journal of Investing (SSRN Working Paper No. 3274499).
Guyton, J. T., & Klinger, W. J. (2006). Decision rules and maximum initial withdrawal rates. Journal of Financial Planning, 19(3), 48–58.
Kitces, M. (2014). Are retirement bucket strategies an asset allocation mirage? Kitces.com Research.
Pfau, W. D., & Kitces, M. E. (2014). Reducing retirement risk with a rising equity glide-path. Journal of Financial Planning, 27(1), 38–45.