In the middle of summer during this unique election year, it seems as if the political noise is already deafening. As we analyze political events and how they may impact the economy and the markets we strive to maintain an agnostic but lucid view of the data. At Pacific Wealth Management, we believe that economies influence politics much more than politics influence economies. Market patterns do emerge under certain circumstances, however, and are worth understanding so we have fair expectations.
The Race and Economic Implications
The presidential race is tight, though Trump is leading in key battleground states. This could mean that, unlike his unexpected win in 2016, the economic impact of a potential Trump presidency might already be factored into market prices before the election. Wall Street is currently betting on a Trump victory.
A second term for Trump would likely result in less regulation, more tariffs, and lower taxes. Joe Kalish, an economic analyst with Ned Davis Research, suggests that Trump's policies would probably boost economic growth and inflation, leading to a steeper yield curve.
The Importance of Congress
The composition of Congress will be crucial for implementing policies. While the President can influence regulations, tariffs, and immigration, major policy changes need Congressional approval. There is significant support for extending some of the Trump tax cuts, but to what extent will depend on who sits in Congress. Recently, the chances of a Republican-controlled Congress have increased.
Trump’s First Term: A Reference Point
During Trump’s first term, growth sectors of the market (Technology (i.e. Microsoft), Communication Services (i.e. Netflix), and Consumer Discretionary (i.e. Amazon) stocks) were the best performing asset classes within the stock market. The tax cuts, lower interest rates, and less corporate regulation led to this outperformance at the time, along with other widespread technological adoption in areas like cloud computing.
This is contradictory to what occurred in the first three weeks after Trump’s surprise victory, where the sectors of the market that led the charge were what one might expect with a Republican in office. These stocks were primarily in banking, construction, and trading and distribution companies, all expected to do well from future infrastructure spending and reduced regulation. These companies are categorized as Value oriented stocks, as opposed to Growth oriented; by the end of Trump’s term, they substantially underperformed on a relative basis.
Fast forward to today: since the first presidential debate on June 27th, a similar pattern is emerging. Wall Street’s initial reaction to an expected Trump win is already mirroring what occurred during the first 3 weeks of Trump’s term in 2016.
Policy Impact on Sector Leadership
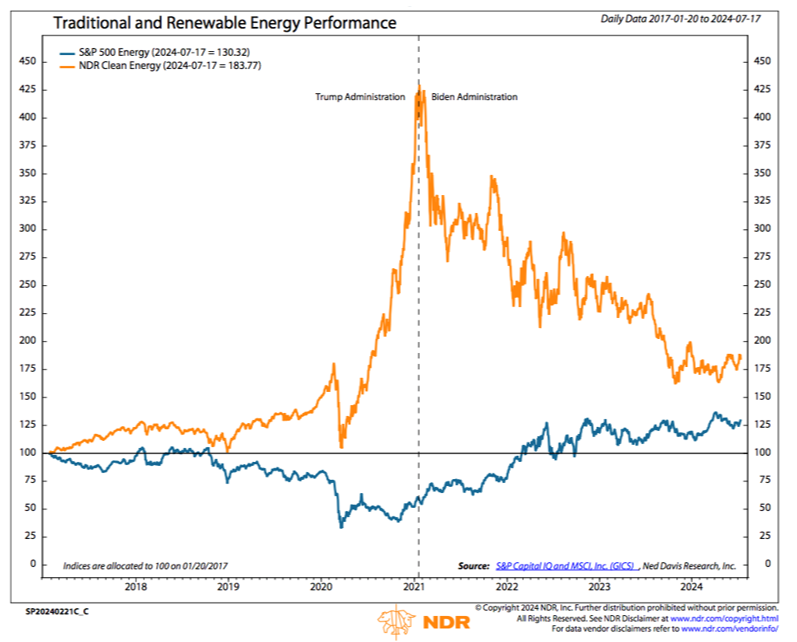
What we’ve also learned in the last eight years is that policy is just one of many drivers of leadership trends in the market. Despite Biden championing clean energy investment during his first term, clean energy stocks have struggled under his presidency (orange line in chart). In contrast, they thrived under Trump as low interest rates, especially post-pandemic, boosted the sector. Conversely, traditional Energy (i.e. Exxon Mobil, Chevron) was the worst performer under Trump but has been the best-performing sector under Biden.
While it can sometimes be volatile, the energy sector is a solidly productive representative of the stock market regardless of who is in the White House. In the short term, the same goes for the Financials sector (i.e. JPMorgan Chase, Visa) where regardless of political party in control, it generally does well during election years.
As the political noise intensifies this year, we will continue to closely and objectively monitor the data to construct and alter portfolios throughout the duration of the year and beyond. Please reach out if you have any questions. We’re happy to be a resource during this unique time.
Disclaimer Statement
Ned Davis Research, Inc. (NDR), any NDR affiliates or employees, or any third-party data provider, shall not have any liability for any loss sustained by anyone who has relied on the information contained in any NDR publication. In no event shall NDR, any NDR affiliates or employees, or any third-party data provider, be liable to any party for any direct, indirect, incidental, exemplary, compensatory, punitive, special or consequential damages, costs, expenses, legal fees, or losses (including, without limitation, lost income or lost profits and opportunity costs) in connection with any use of the information contained in this document even if advised of the possibility of such damages.
The data and analysis contained in NDR's publications are provided "as is" and without warranty of any kind, either expressed or implied. The information is based on data believed to be reliable, but it is not guaranteed. NDR DISCLAIMS ANY AND ALL EXPRESS OR IMPLIED WARRANTIES, INCLUDING, BUT NOT LIMITED TO, ANY WARRANTIES OF MERCHANTABILITY, SUITABILITY OR FITNESS FOR A PARTICULAR PURPOSE OR USE.
NDR's reports reflect opinions of our analysts as of the date of each report, and they will not necessarily be updated as views or information change. All opinions expressed therein are subject to change without notice, and you should always obtain current information and perform due diligence before trading. NDR or its affiliated companies or their respective shareholders, directors, officers and/or employees, may have long or short positions in the securities discussed in NDR's publications and may purchase or sell such securities without notice.
NDR uses and has historically used various methods to evaluate investments which may, at times, produce contradictory recommendations with respect to the same securities. When evaluating the results of prior NDR recommendations or NDR performance rankings, one should also consider that NDR may modify the methods it uses to evaluate investment opportunities from time to time, that model results do not impute or show the compounded adverse effect of transaction costs or management fees or reflect actual investment results, that other less successful recommendations made by NDR are not included with these model performance reports, that some model results do not reflect actual historical recommendations, and that investment models are necessarily constructed with the benefit of hindsight. Unless specifically noted on a chart, report, or other device, all performance measures are purely hypothetical, and are the results of back-tested methodologies using data and analysis over time periods that pre-dated the creation of the analysis and do not reflect tax consequences, execution, commissions, and other trading costs. For these and for many other reasons, the performance of NDR's past recommendations and model results are not a guarantee of future results.
Using any graph, chart, formula, model, or other device to assist in deciding which securities to trade or when to trade them presents many difficulties and their effectiveness has significant limitations, including that prior patterns may not repeat themselves continuously or on any particular occasion. In addition, market participants using such devices can impact the market in a way that changes the effectiveness of such devices. NDR believes no individual graph, chart, formula, model, or other device should be used as the sole basis for any investment decision and suggests that all market participants consider differing viewpoints and use a weight of the evidence approach that fits their investment needs. Any particular piece of content or commentary may or may not be representative of the NDR House View, and may not align with any of the other content or commentary that is provided in the service. Performance measures on any chart or report are not intended to represent the performance of an investment account or portfolio, as some formulas or models may have superior or inferior results over differing time periods based upon macro-economic or investment market regimes. NDR generally provides a full history of a formula or model's hypothetical performance, which often reflects an "all in" investment of the represented market or security during "buy", "bullish", or similar recommendations. This approach is not indicative of the intended usage of the recommendation in a client's portfolio, and for this reason NDR does not typically display returns as would be commonly stated when reporting portfolio performance. Clients seeking the usage of any NDR content in a simulated portfolio back-test should contact their account representative to discuss testing that NDR can perform using the client's specific risk tolerances, fees, and other constraints.
NDR's reports are not intended to be the primary basis for investment decisions and are not designed to meet the particular investment needs of any investor. The reports do not address the suitability of any particular investment for any particular investor. The reports do not address the tax consequences of securities, investments, or strategies, and investors should consult their tax advisors before making investment decisions. Investors should seek professional advice before making investment decisions. The reports are not an offer or the solicitation of an offer to buy or to sell a security.
Further distribution prohibited without prior permission. For data vendor disclaimers, refer to www.ndr.com/vendor-info. Copyright 2024© Ned Davis Research, Inc. All rights reserved.


