


The U.S. Federal Reserve recently initiated its first interest rate cut since the 2020 pandemic, marking a significant shift in economic policy aimed at supporting growth and stability. This move comes amid stronger-than-expected job growth, steady economic expansion, and an improving housing market. Globally, emerging markets are showing resilience, while the stock market continues to rally on the back of lower rates. This summary outlines key trends in the U.S. economy, stock performance, housing, and global markets, offering insights into how these developments may impact investors and future market conditions.
Federal Reserve's Rate Cut
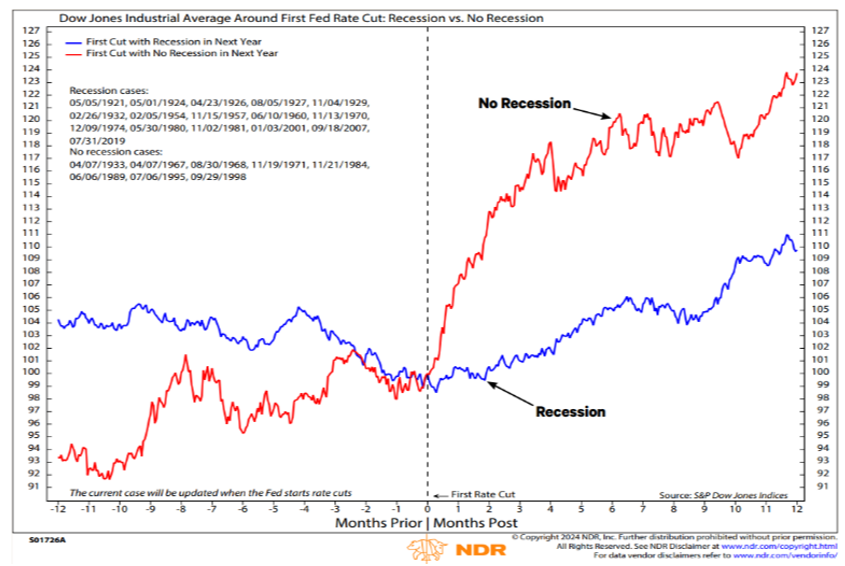
Recently, the U.S. Federal Reserve lowered interest rates by 0.5%, bringing them to a range of 4.75%-5.00%. This move was important because it's the first time rates have been cut since the pandemic in 2020. It also signals the start of a new phase of lower rates, which hasn’t happened often outside of a recession. Lowering rates makes borrowing money cheaper, which can help stimulate the economy.
Economic Growth and Jobs
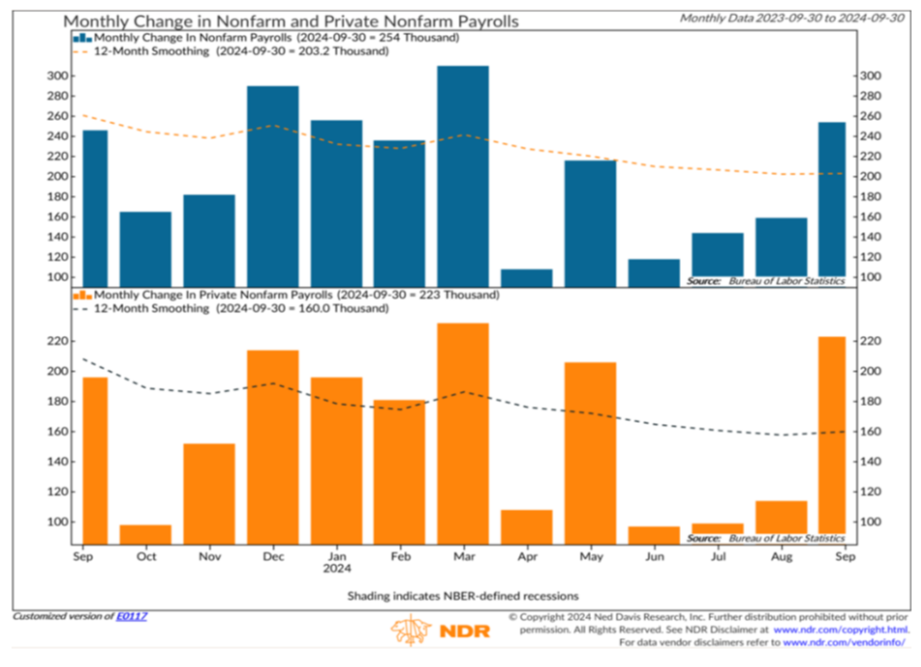
The U.S. economy showed solid growth, with the Real Gross Domestic Product (GDP) increasing by 3% in the second quarter of the year. This is a good sign for economic stability. On top of that, the job market is strong, with over 250,000 new jobs added in September, far surpassing expectations. More people working means more money circulating in the economy, which can lead to increased spending and business activity. The chart below illustrates that jump in jobs added within last month on the far right side.
Stock Market Performance
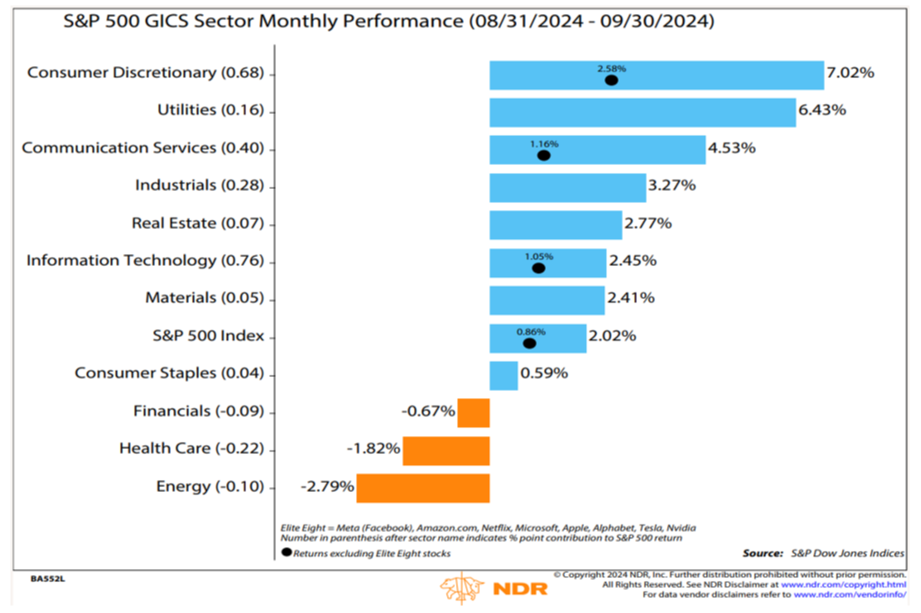
The stock market responded positively to these changes, especially after the Federal Reserve cut rates. The S&P 500 hit new highs in September. Consumer Discretionary and Utilities stocks were the top performers, while energy stocks were the weakest. The strong job market and the Federal Reserve's rate cuts have also boosted certain sectors like Industrials and Technology, which have benefited from falling interest rates and investments in new technologies like artificial intelligence (AI).
Housing Market Update
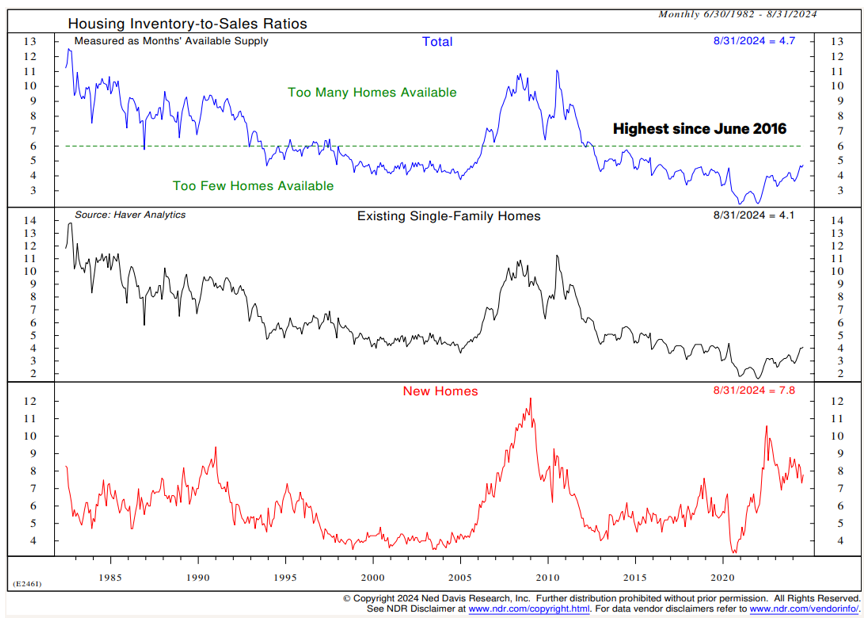
The housing market, which had been slowing down due to high mortgage rates, is beginning to show signs of recovery. Home supply is improving, and mortgage rates have dropped from their peak earlier this year, making it easier for people to buy homes. This drop in mortgage rates, now at about 6%, has helped stabilize home prices and increase the availability of homes for sale.
Global Economy
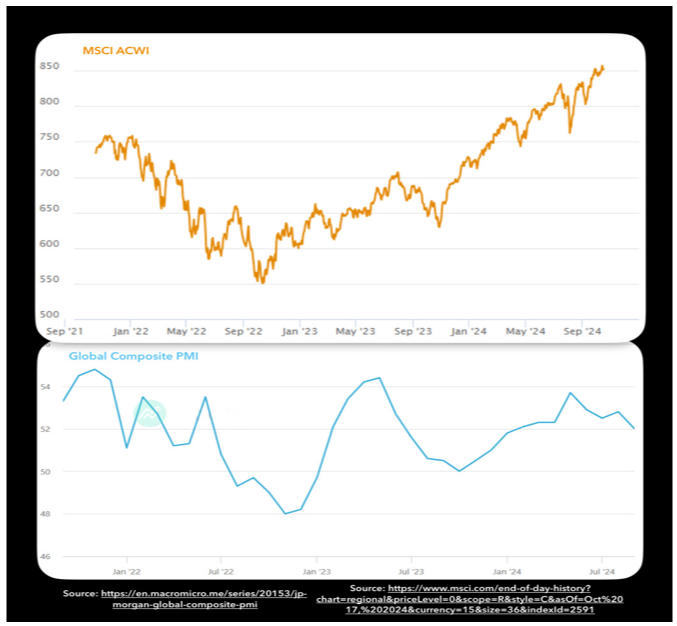
On the global stage, many countries are still facing economic challenges, but growth remains positive. Emerging markets like India and Brazil are leading the way, while developed economies, such as the U.S. and the U.K., are also showing signs of solid growth. The MSCI ACWI (orange line in the chart below; a global equity index that measures stock market performance for developed and emerging economies) has reflected this strength. China’s economy has slowed, but the government is trying to stimulate growth through new policies. Global PMIs (Purchasing Managers Index; blue line in the chart below; an indicator of economic activity) slipped to the lowest levels of the year recently, which could indicate slowing momentum on a global level.
Key Takeaways
For investors, lower interest rates and strong economic growth are positive signals. Historically, when the Federal Reserve lowers rates without a recession, the stock market tends to perform well. The easing of monetary policy, combined with strong job growth, indicates that the economy is in a stable position. However, investors should keep an eye on developments in oil prices and the global economy, especially in countries like China.
Disclaimer: Ned Davis Research, Inc. (NDR) published strategies, including the model discussed in this publication, are intended to be used only by sophisticated and institutional investment professionals. NDR provides guidance on asset allocations through the creation and maintenance of various models. The tactical asset allocation model discussed in this publication was developed specifically for this study and is not a regular model maintained by NDR. It was created with the benefit of hindsight by applying the actual model readings of the real-time Stock/ Bond component of the NDR Global Balanced Account Model since 2012. The model described in this publication is not available to be directly implemented as part of an investment advisory service and should not be taken to be a recommendation of NDR. The results described do not represent actual trading or any type of account or any type of investment vehicle. Except as expressly noted, none of the fees or other expenses associated with actual trading or accounts (e.g. commissions, mark-ups, mark-downs, advisory fees, fund expenses) are reflected in the hypothetical performance described in this publication. These fees and expenses, when compounded over a period of years, would decrease returns. Our calculation of projected hypothetical performance is based in part on information provided by certain third-party sources which NDR believes to be reliable. NDR makes no warranties or representations of any kind relating to the accuracy, completeness, or timeliness of the data such third-party sources provided and shall not have liability for any damages of any kind relating to such data. We calculated the hypothetical returns using the monthly closing prices of the stated indexes or data series reflected in the model composition. The hypothetical back-test allocated the month-end weighting to the month-end price after the market close, which would not be possible in an actual trading situation. The allocation then remains in place until the next monthly model reading is utilized at the end of the following month. IMPORTANT: The model results referenced in this publication are hypothetical in nature, achieved by means of a back-test, do not reflect any actual investment results, and are not an indication or a guarantee of future results. Actual performance returns may differ materially from the hypothetical performance returns of the model for a variety of reasons, including advisory fees, transaction costs, execution slippage, and tax liabilities on realized capital gains, dividends, interest, and other income. Calculation of hypothetical performance using back-tested results has many inherent limitations. There are frequently differences between hypothetical performance results and the actual results subsequently achieved by any particular trading program. One limitation of hypothetical performance results is they are generally prepared with the benefit of hindsight. In addition, hypothetical performance calculations do not involve financial risk, and therefore, do not account for the impact of financial risk associated with actual trading, including the ability to withstand losses or adhere to a particular trading program in spite of trading losses. These are material factors that can adversely affect actual trading results. Numerous other factors cannot be fully accounted for in the preparation of hypothetical performance calculations and can adversely affect actual trading results. NDR has not traded this strategy. Because no actual trading results exist to compare to the hypothetical results, investors should be wary of placing undue reliance on these hypothetical performance results. This hypothetical performance of the model portfolio is likely to differ from any actual investment account, and no representation is being made that any account will or is likely to achieve profits or losses similar to those shown. The hypothetical performance results do not reflect the deduction of an annual advisory fee or other fees and expenses related to investments in mutual funds and exchange traded funds. Had the results reflected these costs, the hypothetical projected performance would have been lower. Further distribution prohibited without prior permission. Full terms of service, including copyrights, terms of use, and disclaimers are available at https://www.ndr.com/web/ndr/terms-of-service. For data vendor disclaimers, refer to www.ndr.com/vendorinfo. Copyright 2020 (c) Ned Davis Research, Inc. All rights reserved.